Market Insights 2013
Making sense of the market. Here we are moving into the selling season in Round Rock and its challenging to make sense of the market place due to various factors.
First let’s look at price and inventory according to the Austin Board of Realtors:
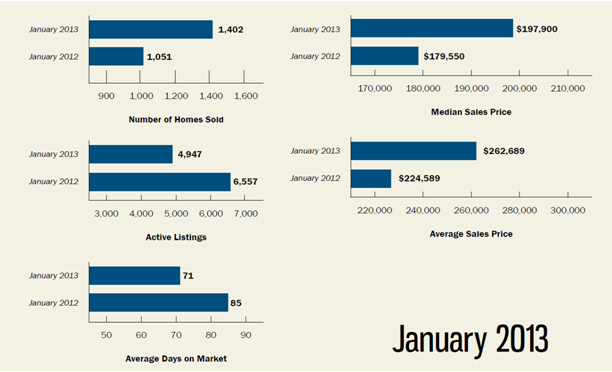
In January 2013, the median price for Austin-area homes
increased to $197,900, which is 10 percent more than the
same month in 2012. Additionally, the market featured 2.5
months of inventory in January 2013, which is 1.6 months
less than January 2012 and the lowest inventory figure seen
in the Austin area in the last decade.
According to the report, the market also featured one percent
fewer new listings, 25 percent fewer active listings and 25
percent more pending sales in January 2013 compared to the
prior year. On average, homes spent 71 days on the market,
which is a decrease of 14 days from one year prior.
According to Chairman Cathy Coneway, “The inventory of homes in
Austin continues to feature unprecedented lows and sales
prices are starting to reflect that. Those entering the market
should be prepared to compete for properties.”
February Stats are similar: According to the report, 1,626 single-family homes were sold in the Austin area in February 2013, which is 26 percent more than February 2012, and the total dollar volume of single-family properties sold was $430,324,152, or 32 percent higher than the same month last year.
Cathy Coneway, 2013 Chairman of the Austin Board of REALTORS®, explained, “Strong demand for Austin homes continues, but the number of listings on the market remains consistent. This has led to steady increases in price while keeping housing inventory at record lows.”
In February 2013, the median price for Austin-area homes increased to $208,500, which is seven percent more than the same month in 2012. Additionally, the market featured 2.6 months of inventory in February 2013, which is 1.6 months less than February 2012.
The market also featured one percent more new listings, 25 percent fewer active listings and 15 percent more pending sales in February 2013 compared to the prior year. On average, homes spent 71 days on the market, which is a decrease of 15 days from one year prior.
February 2013 Statistics
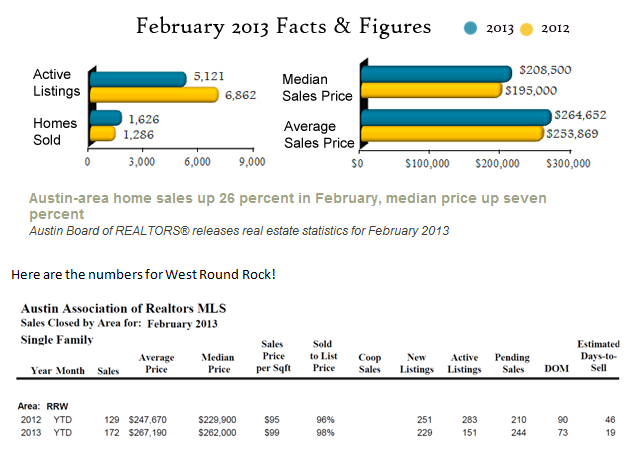
These numbers are dramatic. Notice that the estimated days to sell has dropped by 27 days. New listings are down by 8.7% from last year and active listings are down by 132 homes or 46% from last year! WOW! Prices are up on average by nearly 8%.